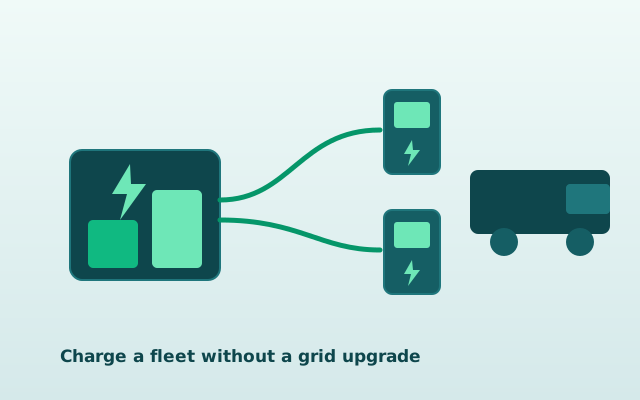
Typical ev fleet charging buffer system
- Energy capacity
- 200–1,000 kWh
- Power rating
- 150–600 kW
- C-rate
- 0.75C
- Round-trip efficiency
- 90%
- Cycle warranty
- 8,000 cycles / 12 years
- Typical project value
- £100,000–£500,000
- Simple payback
- 7 years
- Typical annual saving
- £25,000–£140,000/year
Value streams: Grid-upgrade avoidance for high-power charging · Charging-window arbitrage · Demand-charge smoothing
Standards & compliance: Sized to the depot's simultaneous-charging profile, not nameplate charger power. Smart-charging integration and load management to BS EN / OZEV-grant compatible standards.
Designed to PAS 63100 and the IET Code of Practice for EESS · BS EN 62619 cells / BS EN 62933 system · G99 connection (G100 export limitation where required).
Why this use case matters for UK businesses
Electrifying a fleet is rarely held up by the vehicles. It is held up by the connection. A depot that runs a bank of rapid chargers needs a large, spiky power draw concentrated into a short charging window, and that draw routinely exceeds the site’s agreed import capacity. The conventional answer is a DNO reinforcement: a bigger connection, possibly a new transformer or substation work, often a six-figure bill and a wait measured in many months. For a lot of operators that quote is the moment fleet electrification stalls.
A behind-the-meter battery changes the arithmetic. Because the battery sits on your side of the meter, it lets the site draw more power during the charging peak than the connection alone would allow. The chargers pull from the battery and the grid together, so the grid never sees the full simultaneous-charging spike. That is the core grid-constraint angle: you can bring rapid chargers, more vehicles, or extra shifts online without paying to reinforce the supply.
There is a running cost dimension too. Fleet charging is, by definition, a large and controllable load, which makes it a near-perfect candidate for arbitrage. Charge the battery overnight on the cheapest off-peak power, then use it to top up vehicles through the day, and you cut both the unit cost of the energy and the demand charges that come with drawing heavily at peak. The result is a system that does two jobs at once: it removes a capital roadblock and lowers the cost of every mile.
How the battery does it
Start with your half-hourly meter data, because that is where the real charging profile lives. Nameplate charger power is misleading: ten 60 kW rapid chargers do not mean a 600 kW continuous draw, because vehicles arrive and depart, taper as they approach full, and rarely all peak at the same instant. We model the depot’s actual simultaneous-charging profile from the half-hourly readings and the duty cycle of the fleet to find the genuine coincident peak and how long it lasts.
The battery is then sized to bridge the gap between that coincident peak and what the connection can supply. During the charging window, the chargers draw from the grid up to the available import capacity, and the battery discharges to make up the difference. A 250 kW / 500 kWh unit can deliver 250 kW on top of the existing connection for around two hours; a larger 600 kW system covers a deeper, sharper depot peak. The battery itself recharges in the cheap overnight hours when the depot is quiet and grid prices are low, so it is full and ready for the next charging window.
Layered on top is smart-charging integration and load management. The control system coordinates the chargers, the battery, and the site’s other loads so that the combined draw never breaches the import limit, prioritising vehicles by departure time and discharging the battery exactly when the chargers need it most. Where solar is present on the depot roof, the same controller folds PV generation into the mix, lifting on-site self-consumption and trimming daytime grid imports further. This is the same demand-charge logic explored in peak-shaving, applied to the one load that defines a charging depot.
Sizing and economics
EV fleet buffers are sized on two axes that must be quoted together: power and energy. Power, in kW, is how hard the battery can push, and it has to match the gap your chargers need filled at peak. Energy, in kWh, is how long it can sustain that push, and it has to cover the full charging window. For this use case we typically deploy 200-1,000 kWh of energy and 150-600 kW of power, at a C-rate of around 0.75C, round-trip efficiency near 90%, and a cycle warranty of 8,000 cycles or 12 years. The cells are lithium iron phosphate (LFP), chosen for thermal stability and cycle life under the heavy daily duty a depot imposes.
Typical project value runs from £100,000 to £500,000 depending on power and energy. As a rough guide, commercial-scale storage lands at £200-£450 per kWh, and larger containerised systems at £140-£240 per kWh, so a bigger fleet buffer benefits from better unit economics. What drives the cost up or down is the depth of the coincident peak, the duration of the charging window, the connection and switchgear works, and any export limitation or network management the DNO requires.
The economics stack from three streams. The largest is usually grid-upgrade avoidance: sidestepping a DNO reinforcement that could itself cost six figures. Then comes charging-window arbitrage, charging on the cheapest off-peak power and discharging into the day. Then demand-charge smoothing, which trims the available-capacity (kVA) charges and red-band DUoS costs that a spiky charging load would otherwise rack up. Together these typically deliver £25,000-£140,000 a year, for a simple payback around seven years on a 12-year asset. Note the tax position: commercial battery storage is standard-rated at 20% VAT, recoverable in full by a VAT-registered business, and the £1m Annual Investment Allowance lets you deduct the full cost against profits in year one. See cost for the full breakdown and grants-and-funding for the revenue and allowance position.
A worked example
Consider a regional logistics operator running a delivery depot with an agreed import capacity of 250 kW. It wants to install eight 60 kW rapid chargers to charge a growing electric van fleet overnight and during driver changeovers. On paper that is 480 kW of charger nameplate power, far beyond the connection. The DNO quotes a reinforcement at roughly £180,000 with a lead time stretching past a year.
Modelling the half-hourly data and the fleet’s duty cycle shows the genuine coincident peak is closer to 360 kW for about two hours during the early-evening changeover, not the full 480 kW. The operator installs a 300 kW / 600 kWh LFP battery. During the changeover the chargers draw up to the 250 kW connection limit while the battery supplies the additional 110 kW or more, so the grid never sees the spike and no reinforcement is needed. Overnight the battery refills on off-peak power.
The numbers stack up as follows. Avoiding the £180,000 reinforcement is the headline. On top of that, charging-window arbitrage and demand-charge smoothing on the heavy daily load save in the order of £45,000 a year against standard daytime rates and avoided kVA charges. The system is priced at around £210,000 before the in-year AIA deduction. With grid-upgrade avoidance folded in alongside the running savings, simple payback lands near seven years, and the asset carries a 12-year cycle warranty. The figures are illustrative; your quote is modelled from your own half-hourly data.
Compliance and grid connection
A fleet buffer of this size is a G99 DNO application, not G98, and the application should go in early because timescales run from eight weeks to twelve months. The DNO may grant the connection with export limitation, since a behind-the-meter buffer for charging has no need to export, or attach an Active Network Management (ANM) condition. Export limitation is usually straightforward to accept here: the battery exists to serve the chargers, not to push power back onto the network.
The system is designed to the IET Code of Practice for Electrical Energy Storage Systems and to BS EN/IEC 62933 and IEC 62619, with fire, thermal, detection and separation design appropriate to the depot. Work falls under CDM 2015, and the insurer is engaged before energisation. Critically, the battery is sized to the depot’s simultaneous-charging profile drawn from real meter data rather than to nameplate charger power, and the smart-charging and load-management layer enforces the import limit at all times. Confirm your installer is MCS-certified for battery storage and NICEIC approved, and that the workmanship warranty is insurance-backed.
Who it suits — and who it doesn’t
This suits any operator whose charging demand outruns the connection: van and HGV depots, bus and coach yards, last-mile logistics hubs, and any site facing a costly DNO reinforcement to electrify. It is strongest where the charging window is concentrated, the coincident peak is well above the import capacity, and the reinforcement quote is large or the lead time unworkable. It is also a good fit where the depot wants headroom to add chargers or shifts later without going back to the DNO.
It suits you less if your connection already comfortably supplies the chargers, in which case smart charging and load management alone may handle the peaks without a battery. It is weaker where charging is spread thinly across the day with no real coincident peak, or where the fleet is small enough that a modest connection upgrade is cheaper than storage. We model the half-hourly data first and say so plainly if a battery does not stack up. If your driver is purely cutting peak unit rates rather than enabling chargers, energy arbitrage may be the more direct route. Either way, request a quote and we will size it from your data.
Frequently asked questions
Do I still need a grid connection upgrade if I install a battery? Often not. The point of the buffer is to let the chargers draw more at peak than the connection alone allows, so a battery frequently replaces a six-figure DNO reinforcement entirely. We confirm this by modelling your half-hourly data against the charger profile before quoting.
How is the battery sized — by my charger power? No. It is sized to the depot’s simultaneous-charging profile, the genuine coincident peak across all chargers and how long it lasts, not the summed nameplate power. Charger nameplate almost always overstates the real draw, which is why modelling the half-hourly data matters.
Can the battery charge the vehicles overnight on cheap power? Yes. The battery refills during off-peak hours when the depot is quiet and grid prices are lowest, then discharges into the charging window. That charging-window arbitrage cuts the unit cost of the energy and is one of the three streams behind the typical £25,000-£140,000 annual saving.
See also
Depot charging work often needs a local electrical contractor on the ground for the final connections and containment. In Essex and the eastern M11 corridor we point operators to Future Smart Electrical in Harlow.
Model ev fleet charging buffer for your site
Send the postcode and your rough annual spend. We size the system for ev fleet charging buffer specifically and show whether the numbers work.
What you get, within 3 working days: a 2-page battery feasibility summary naming your indicative system size (kW and kWh), the installed cost band, which value streams actually apply to your site (peak-shaving, red-band DUoS avoidance, load shifting, solar self-consumption, grid services), and an honest payback range. If storage does not stack up for your site, the summary says so.
- We do not run a lead auction. Your details are never sold or passed to a panel of installers.
- No marketing list, no newsletter sign-up, no unsolicited calls.
- We will not oversize a system to inflate a quote, or model a payback we cannot defend.
Published by SEO Dons, a specialist commercial energy information network. We are independent: we are not an energy supplier and not a battery manufacturer.